Categories
London Bus Pal

Map views are here!!

I was hoping to get this out there quicker, but rather late then never!

This week I added some map views of all the data to London Bus Pal.  There are four “distinct” views of data in the application, but only three maps are interesting (seeing a single bus stop isn’t the most interesting view!).

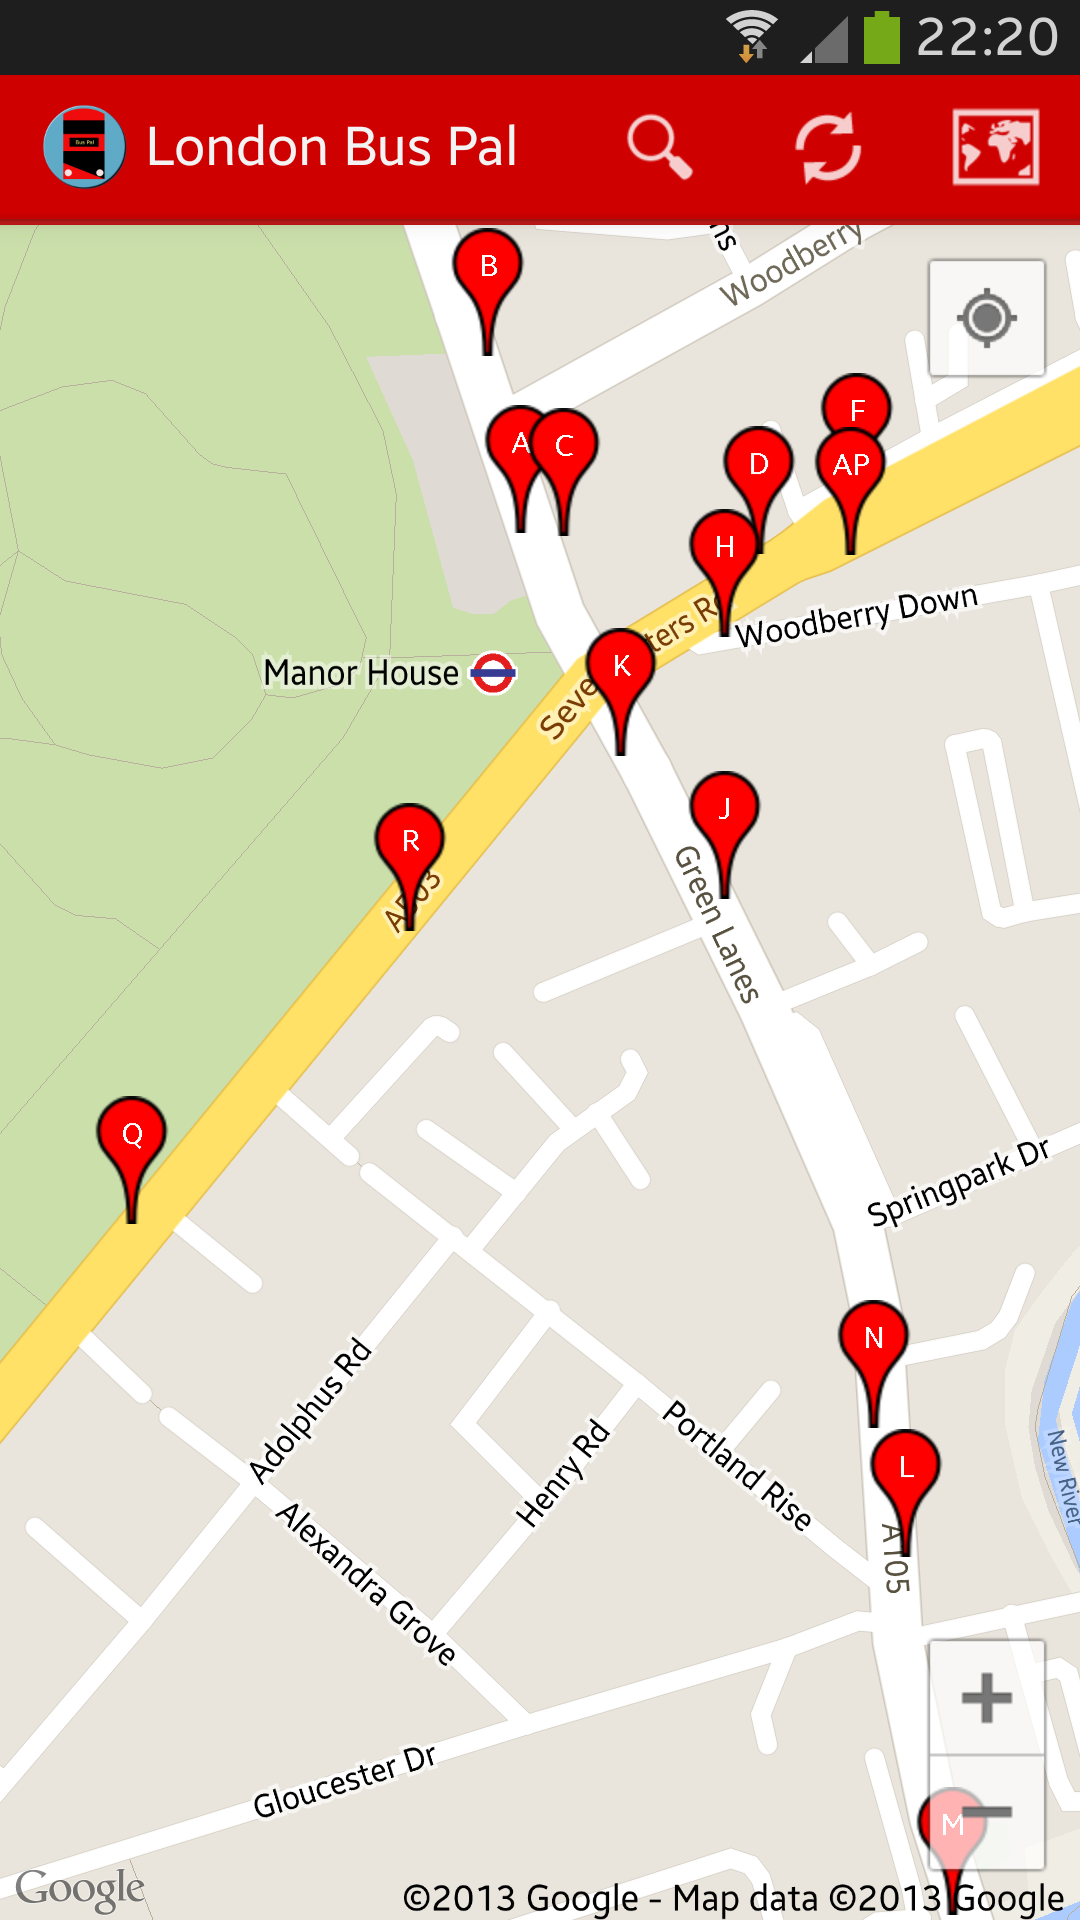
Multi-stop view

If you switch to the map view from a list with multiple bus stops on, you will get a view similar to this.  It shows you markers of all the stops near you with their “letter” indicators on, it there are any.  This is a really useful view to see any bus stops in the area or near somewhere else you might be going (try searching by post code).  Tapping any of the markers will give you the name of the stops and where it goes – if you tap on the information box that appears, you will then be taken to the screen to see the estimated arrival times for all buses serving that stop.

Screenshot_2013-09-21-22-20-51

Bus prediction view

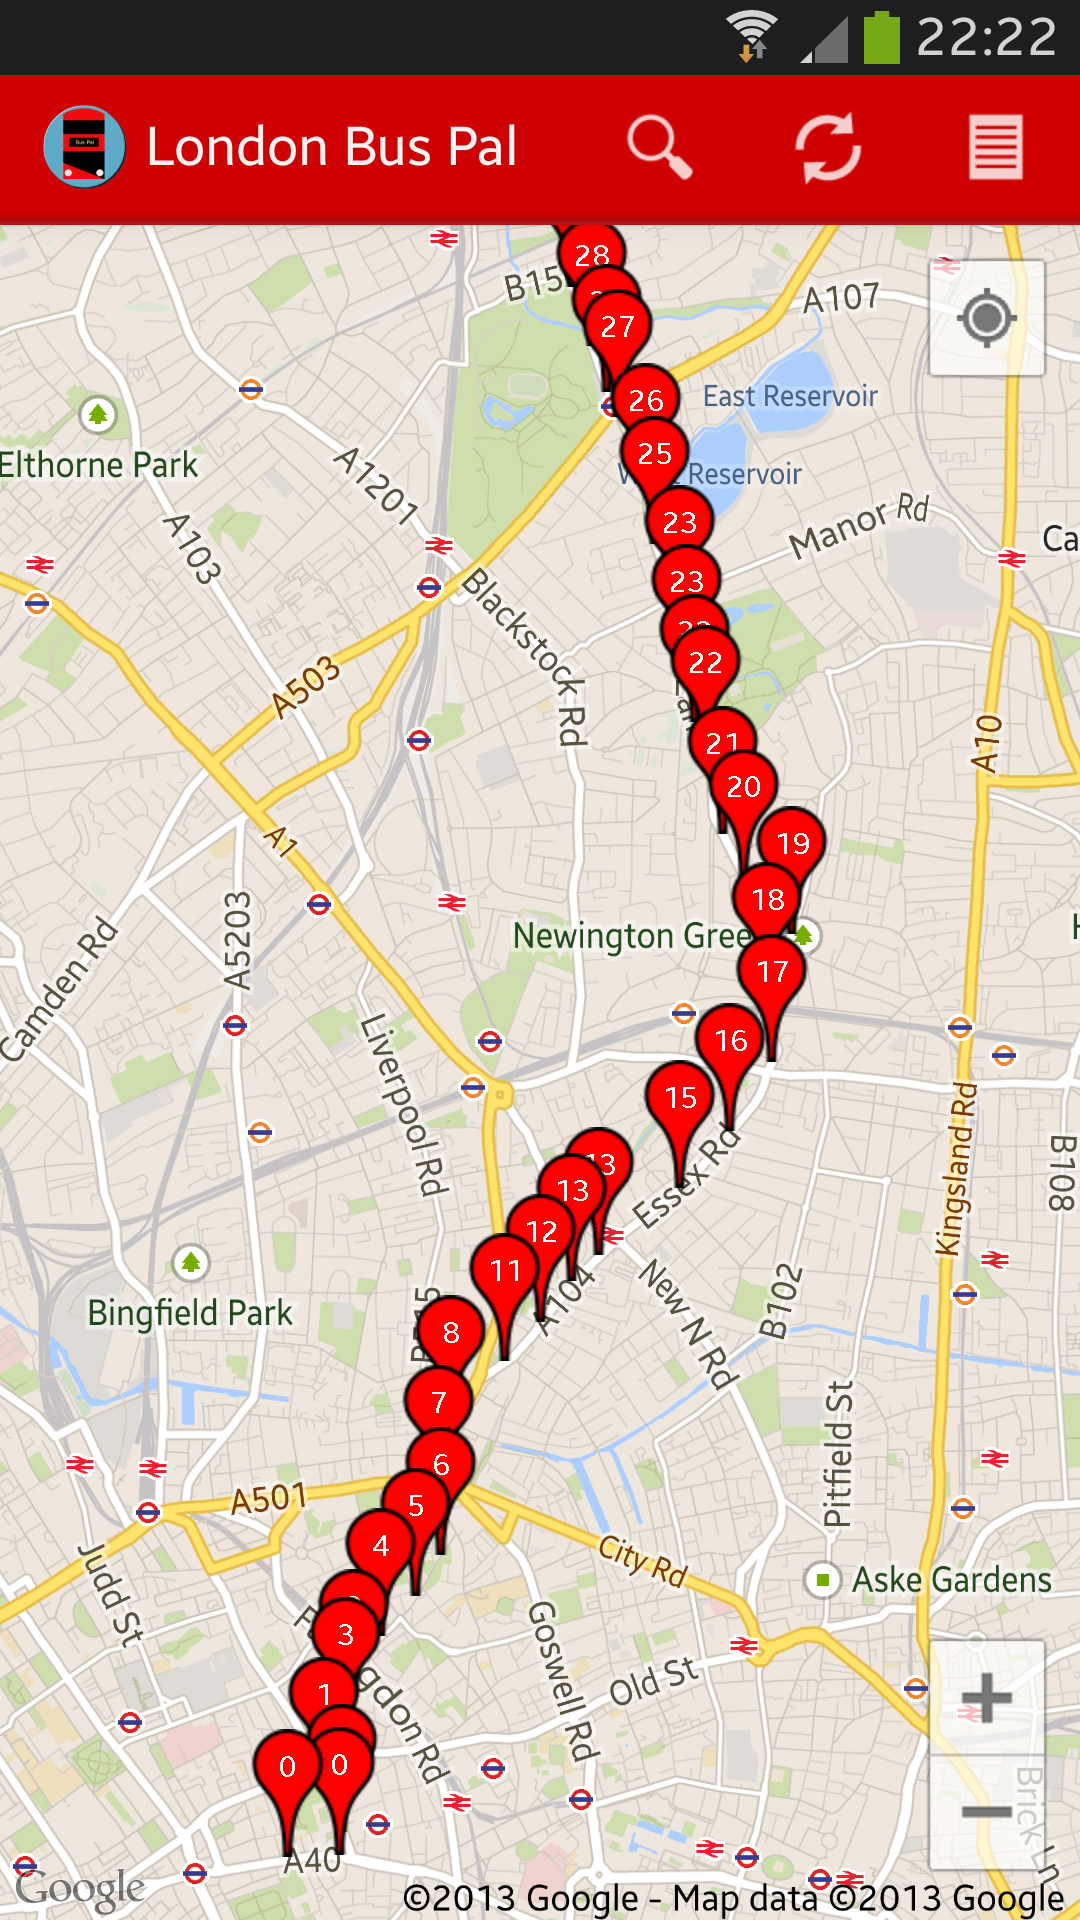
The next view that is possible is one showing you a list of all stops for any specific bus over the next 30 minutes and the number on the marker indicates how many minutes the bus is expected to take to get there.

Screenshot_2013-09-21-22-22-27

Bus route view

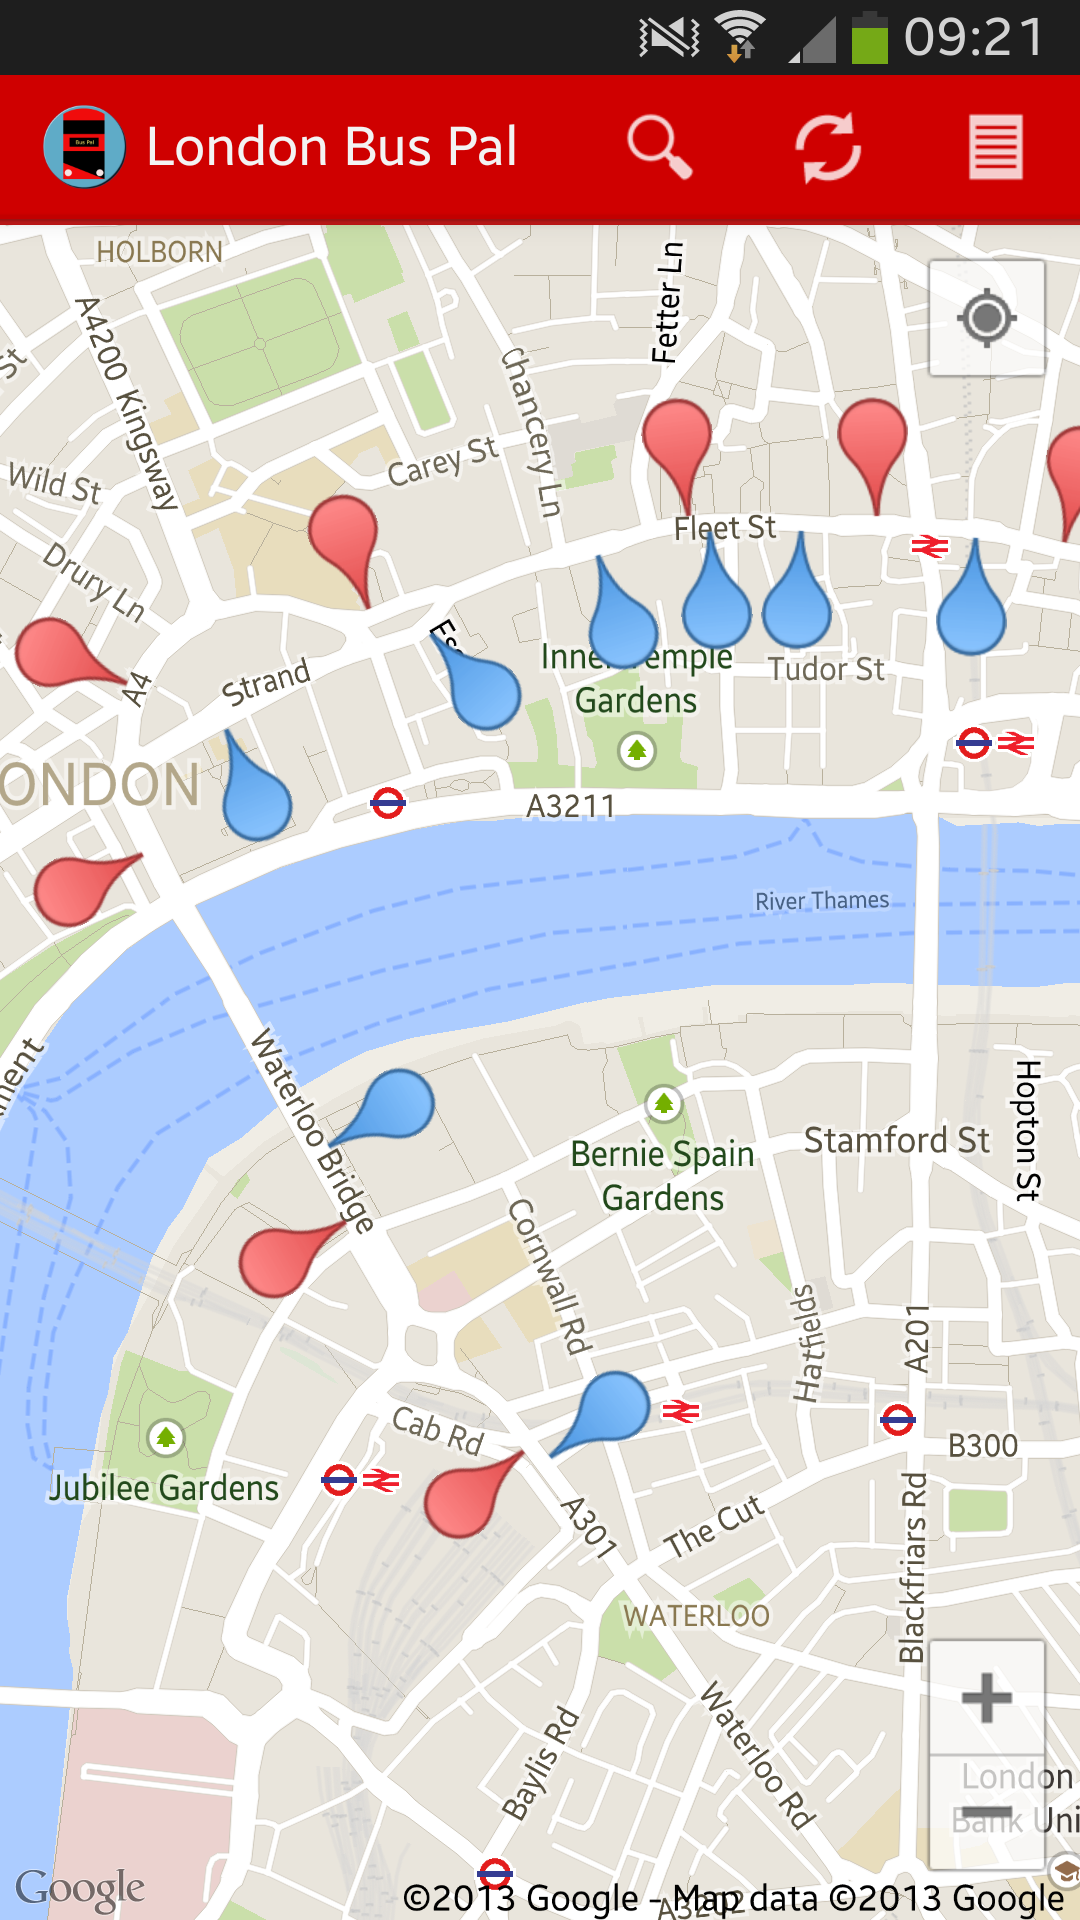
The last view I want to show you, is the bus route view.  This is a calculated route based on all buses for that route over the next 30 minutes showing their stops.  Red markers indicate one direction and blue markers indicate another direction.  The pins are also arranged so that you can get an idea of which way the bus is going (I will add some arrows soon!)

Screenshot_2013-09-22-09-21-17

If you don’t have London Bus Pal yet, you can download it from the Google Play Store: https://play.google.com/store/apps/details?id=com.mulder.buspal
 

Categories
London Bus Pal

Just how accurate is TfL’s countdown system?

Just how accurate is TfL‘s countdown system

When I started developing London Bus Pal, the one thing that was always going to be completely out of my control was going to be the actual prediction data. I did some investigation as to how it all works and it’s really interesting, but probably worth a blog post of it’s own (so watch this space)!

There are a number of bus routes which I take frequently and I have definitely noted a pattern of “lateness” compared to the estimated times for specific buses at specific times.

I decided to take a small sample of buses and compare their estimated arrival times in 30 minutes to how it changed after 15 minutes and then to when they actually arrived.  The results were interesting (but not a big enough sample to draw any conclusions):

  • 341 to Angel Road Superstores.
    • First estimate: 28 minutes
    • After 15 minutes: 28 minutes
    • Final time to destination: 30 minutes (2 minutes later than initially predicted)
  • 19 to Finsbury Park Station
    • First estimate: 27 minutes
    • After 15 minutes: 27 minutes
    • Final time to destination: 27 minutes (exactly the time it estimated 27 minutes before)
  • 152 to Pollards Hill
    • First estimate: 29 minutes
    • After 15 minutes: 32 minutes
    • Final time to destination: 37 minutes (8 minutes later than initially predicted)
  • 55 to Bakers Arms
    • First estimate: 29 minutes
    • After 15 minutes: 30 minutes
    • Final time to destination: 35 minutes (6 minutes later than initially predicted)
  • 3 to Oxford Circus
    • First estimate: 28 minutes
    • After 15 minutes: 28 minutes
    • Final time to destination: 25 minutes (actually arrived 3 minutes earlier than initially predicted)

The times measured for the 341, 19 and 55 were all on parts of their route through central London.  The 152 and 3 were both for parts outside central London.

Obviously, when measuring and estimating bus times, there are loads of variables.  My experience in general however, is that the estimation is quite accurate up to about 20 minutes.

When I put together the above list, several things sprung to mind as to why some buses are seemingly more accurate than others.  Traffic, bus spacing (time between two buses on the same route) and route controllers are in my top list of what could affect it.  For instance, the 152 might have been made deliberately late because of another bus running late to maintain an even spacing (or it could just have been stuck in traffic).  I have a theory that it’s probably easier to predict bus times for high frequency routes compared to lower frequency routes, but I will probably have to prove that later!

I used London Bus Pal to compile the above data.  It’s an Android application  and has access to all the bus time prediction information for all London buses.  You can download it here: https://play.google.com/store/apps/details?id=com.mulder.buspal